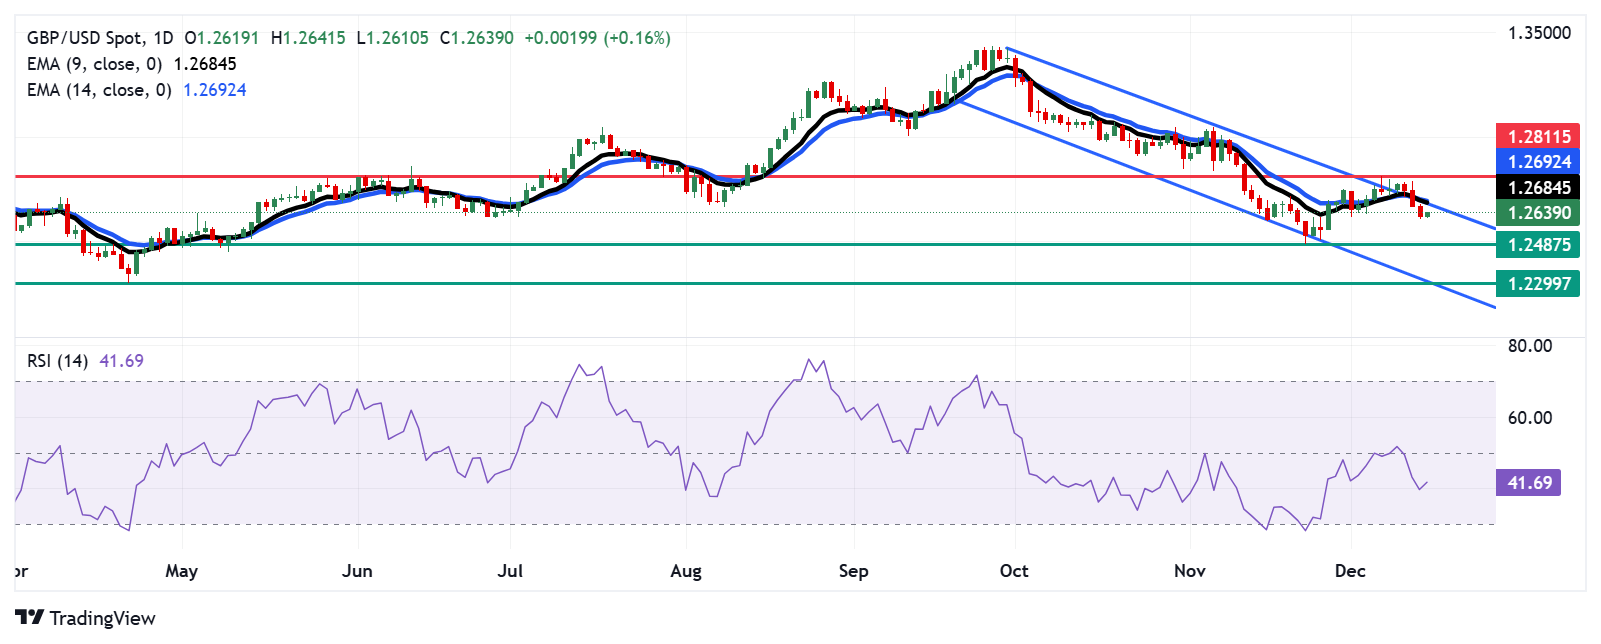
GBP/USD trades near 1.2640 during early European hours on Monday, breaking a three-day losing streak but remaining under pressure within a descending channel. The pair hovers below the channel’s upper boundary and the nine-day Exponential Moving Average (EMA) at 1.2684, reinforcing a bearish outlook.
On the daily chart, the bearish sentiment is underlined by the 14-day Relative Strength Index (RSI), which stays below the neutral 50 mark, signaling weak momentum. Additionally, the pair trades below both the nine-day and 14-day EMAs, further suggesting limited upside potential in the short term.
Key Support Levels
The immediate downside target for GBP/USD lies near its four-week low of 1.2487, recorded on November 22. A decisive break below this level could intensify the bearish momentum, potentially pushing the pair toward the descending channel’s lower boundary near its yearly low of 1.2299, last seen on April 22.
Resistance Levels
On the upside, the initial resistance is pegged at the descending channel’s upper boundary, aligned with the nine-day EMA at 1.2684. A breakout above this level could ease the bearish pressure and pave the way for a recovery toward the recent five-week high of 1.2811, marked on December 6.
Until GBP/USD breaks out of its descending channel, the broader bias remains tilted toward further downside risks.
GBP/USD: Daily Chart

British Pound PRICE Today
The table below shows the percentage change of British Pound (GBP) against listed major currencies today. British Pound was the strongest against the US Dollar.
| USD | EUR | GBP | JPY | CAD | AUD | NZD | CHF | |
|---|---|---|---|---|---|---|---|---|
| USD | -0.12% | -0.14% | -0.09% | -0.06% | -0.18% | -0.26% | -0.28% | |
| EUR | 0.12% | 0.04% | 0.13% | 0.13% | 0.12% | -0.05% | -0.10% | |
| GBP | 0.14% | -0.04% | -0.04% | 0.09% | 0.08% | -0.12% | -0.14% | |
| JPY | 0.09% | -0.13% | 0.04% | 0.02% | -0.07% | -0.14% | -0.10% | |
| CAD | 0.06% | -0.13% | -0.09% | -0.02% | -0.07% | -0.21% | -0.23% | |
| AUD | 0.18% | -0.12% | -0.08% | 0.07% | 0.07% | -0.17% | -0.22% | |
| NZD | 0.26% | 0.05% | 0.12% | 0.14% | 0.21% | 0.17% | -0.04% | |
| CHF | 0.28% | 0.10% | 0.14% | 0.10% | 0.23% | 0.22% | 0.04% |
The heat map shows percentage changes of major currencies against each other. The base currency is picked from the left column, while the quote currency is picked from the top row. For example, if you pick the British Pound from the left column and move along the horizontal line to the US Dollar, the percentage change displayed in the box will represent GBP (base)/USD (quote).

Leave a Reply