Cardano, a decentralized blockchain platform and cryptocurrency (ADA), aims to provide a secure and scalable foundation for decentralized applications (dApps) and smart contracts. Launched in 2017 by the Cardano Foundation and developed by IOHK (Input Output Hong Kong), Cardano stands out for its research-driven development, which relies on peer-reviewed academic studies. It operates on Ouroboros, a proof-of-stake consensus mechanism designed to enhance energy efficiency and network security.
Price Action and Elliott Wave Analysis
Cardano concluded a bearish cycle in June 2023, marking a significant low. From this point, ADA rallied in a 5-wave structure, peaking in March 2024. A subsequent corrective pullback ensued, which completed in August 2024. Following this correction, Cardano resumed its upward momentum, forming a new impulse wave.
After surpassing its March 2024 high, the focus shifted to identifying the next buying opportunity. According to Elliott Wave theory, the next pullback was expected to form either a 3-swing (zigzag) or a 7-swing (double zigzag) structure. These patterns often serve as reliable setups for continued bullish momentum.
Outlook
With Cardano now poised to approach the $2 mark, the current rally aligns with the broader technical setup. Investors and traders will watch for further confirmation of the impulsive structure and any potential retracements, which could offer attractive entry points.
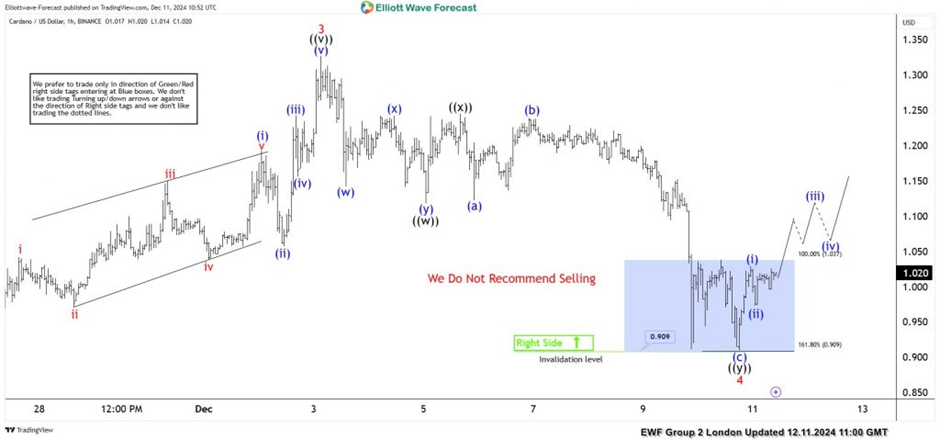
Cardano (ADA/USD) Elliott Wave chart – 12.11.2024

ADAUSD, H1
On 12.11.2024, we shared the chart above with members citing a 7-swing structure for wave 4 on the H1 chart. In addition, we identified the 1.037-0.909 as the key blue box zone. We expected new buyers from the blue box to cause at least a 3-swing bounce if not a 5-wave recovery for wave 5. Price reached the blue and bounced as we expected. For trade management, we advised members to take partial profit at 1.066.
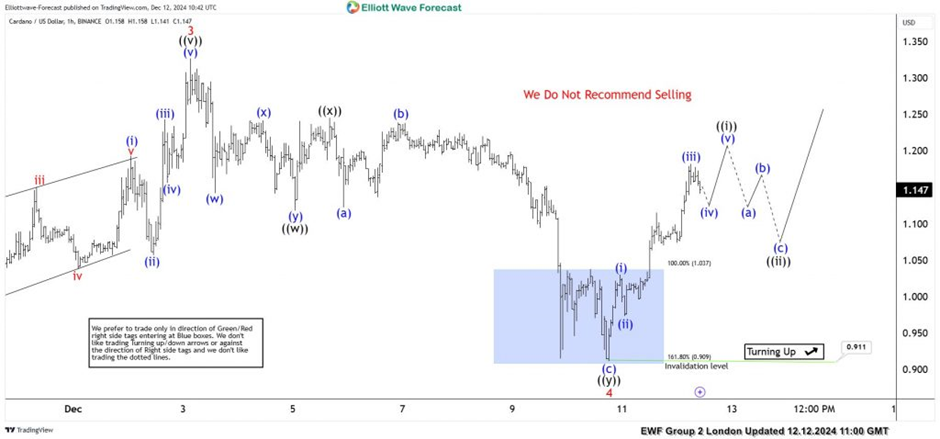
Cardano (ADA/USD) Elliott Wave chart – 12.12.2024

ADAUSD, H1
On 12.12.2024, a day after, we shared the chart above with members. The price shows a swift separation from the blue box just as we expected. In addition, price surpassed the risk-free area. Thus, traders now run a risk-free trade after taking partial profit. Going forward, we expect wave ((i)) of 5 to finish. Afterwards, a retracement in wave ((ii)) will follow. For as long as the pullback ends above 0.911, the upside should continue.

Leave a Reply