Author: admin25

  • EUR/USD Climbs Near 1.0500 as Francois Bayrou Becomes French Prime Minister

    EUR/USD Climbs Near 1.0500 as Francois Bayrou Becomes French Prime Minister

    The EUR/USD pair advanced toward the 1.0500 mark on Friday as the US Dollar surrendered its intraday gains. The Euro found support after French President Emmanuel Macron appointed centrist ally Francois Bayrou as Prime Minister, signaling the potential for greater political stability in France.

    French Political Developments

    Macron’s appointment of Bayrou follows the resignation of Michel Barnier, whose government collapsed after losing a confidence vote in Parliament. Barnier faced backlash from both far-right and left-wing factions over a controversial fiscal budget proposal, which included €60 billion ($62.9 billion) in tax hikes. Bayrou’s immediate priority will be securing the passage of a special law to roll over the 2024 budget, with a tougher legislative battle anticipated over the 2025 budget early next year.

    The resolution of political instability in France has bolstered the Euro (EUR) in the short term, though its broader outlook remains subdued due to expectations of further European Central Bank (ECB) rate cuts.

    ECB Policy Outlook

    The ECB reduced its Deposit Facility Rate by 25 basis points (bps) to 3% on Thursday, with ECB President Christine Lagarde hinting at more rate cuts ahead. Lagarde expressed concerns about slowing Eurozone growth, citing weak exports, declining business investment, and contracting manufacturing. She emphasized that the ECB remains committed to returning inflation to its 2% target by 2025.

    Lagarde also revealed that some ECB officials had supported a larger 50-bps rate cut, highlighting concerns about faltering economic growth. The latest ECB staff projections indicate lower-than-expected Eurozone growth of 0.7% in 2024 and 1.1% in 2025.

    Eurozone economic data released Friday showed mixed results. Industrial Production was flat in October after a sharp contraction in September, outperforming expectations of a 0.1% decline. Year-over-year, Industrial Production fell by 1.2%, better than the anticipated 1.9% drop.

    US Dollar Dynamics

    The US Dollar Index (DXY) dipped below 107.00 despite firm expectations of a hawkish Federal Reserve stance. The Fed cut its key borrowing rate by 25 bps to a range of 4.25%-4.50% on Wednesday. While markets expect rates to remain unchanged in January, the Fed’s hawkish tone reflects persistent inflation pressures and stronger-than-expected economic data.

    The US Producer Price Index (PPI) for November accelerated faster than expected, with headline PPI and Core PPI rising 3% and 3.4% year-over-year, respectively. Analysts at Macquarie noted that slowing disinflation, a lower-than-forecast unemployment rate, and buoyant financial markets are contributing to the Fed’s more cautious stance on policy easing.

    Market Outlook

    EUR/USD remains supported near 1.0500 amid optimism surrounding French political developments and a weaker US Dollar. However, continued ECB dovishness and slowing Eurozone growth could limit the pair’s upside in the medium term. Traders will closely monitor upcoming US and Eurozone economic data and central bank policy updates for further direction.

    Technical Analysis: EUR/USD rebounds but stays below 20-day EMA

    EUR/USD rebounds to near the psychological figure of 1.0500. However, the outlook of the major currency pair remains bearish as it retreated after a mean-reversion move to near the 20-day Exponential Moving Average (EMA) around 1.0580, which is close to 1.0550 at the press time. 

    The 14-day Relative Strength Index (RSI) dives below 40.00, suggesting a resumption of the downside momentum.

    Looking down, the two-year low of 1.0330 will provide key support. Conversely, the 20-day EMA will be the key barrier for the Euro bulls.

    FAQs for ECBs

    How does the European Central Bank affect the Euro?

    The Eurozone’s reserve bank is the European Central Bank (ECB), located in Frankfurt, Germany. The ECB oversees the region’s monetary policy and sets interest rates. Maintaining price stability, or limiting inflation at about 2%, is the major responsibility of the ECB. Interest rate changes are its main means of accomplishing this. A stronger Euro is typically the outcome of relatively high interest rates, and vice versa. Eight times a year, the ECB Governing Council meets to decide on monetary policy. Six permanent members, including Christine Lagarde, the president of the European Central Bank, and the presidents of the Eurozone’s national banks make decisions.

    How does Quantitative Easing (QE) impact the Euro and what is it?

    The European Central Bank has the authority to implement quantitative easing as a policy tool in dire circumstances. The ECB creates euros and uses them to purchase assets from banks and other financial institutions, typically corporate or government bonds. This procedure is known as quantitative easing. A weaker Euro is typically the outcome of QE. When merely cutting interest rates is unlikely to accomplish the goal of price stability, quantitative easing (QE) is the last option. The ECB employed it throughout the COVID pandemic, the Great Financial Crisis of 2009–2011, and 2015, when inflation remained stubbornly low.

    How does the Euro get affected by quantitative tightening (QT)?

    The opposite of QE is quantitative tightening (QT). It is carried out when inflation begins to rise and an economic recovery is under way, following quantitative easing. In QT, the European Central Bank (ECB) stops purchasing new bonds and reinvesting the principal on the assets it already owns, whereas in QE, the ECB buys government and corporate bonds from financial institutions to give them liquidity. For the Euro, it is often bullish or favorable.

  • Bundesbank Forecasts 0.2% Contraction in German Economy for 2024, Modest Growth Ahead

    Bundesbank Forecasts 0.2% Contraction in German Economy for 2024, Modest Growth Ahead

    In its monthly report released Friday, the Bundesbank projected a 0.2% contraction in Germany’s Gross Domestic Product (GDP) for 2024, followed by limited growth of 0.2% in 2025 and 0.8% in 2026.

    Key Highlights:

    • The German economy is expected to stagnate during the winter months, with a slow recovery anticipated throughout 2025.
    • Trump-era tariffs could reduce German economic growth by an estimated 1.3% to 1.4% by 2027.
    • Structural challenges and economic headwinds continue to weigh on the country’s performance.
    • Persistent economic weakness is now having a noticeable impact on the labor market.

    Germany faces a challenging road ahead, with ongoing structural issues compounding the effects of economic slowdowns and external trade pressures.

    Euro PRICE Today

    The table below shows the percentage change of Euro (EUR) against listed major currencies today. Euro was the strongest against the Japanese Yen.

     USDEURGBPJPYCADAUDNZDCHF
    USD -0.21%0.25%0.52%-0.01%-0.08%0.00%0.22%
    EUR0.21% 0.46%0.76%0.19%0.13%0.22%0.44%
    GBP-0.25%-0.46% 0.29%-0.27%-0.34%-0.24%-0.03%
    JPY-0.52%-0.76%-0.29% -0.53%-0.61%-0.53%-0.31%
    CAD0.01%-0.19%0.27%0.53% -0.08%0.02%0.23%
    AUD0.08%-0.13%0.34%0.61%0.08% 0.09%0.30%
    NZD-0.01%-0.22%0.24%0.53%-0.02%-0.09% 0.21%
    CHF-0.22%-0.44%0.03%0.31%-0.23%-0.30%-0.21% 

    The heat map shows percentage changes of major currencies against each other. The base currency is picked from the left column, while the quote currency is picked from the top row. For example, if you pick the Euro from the left column and move along the horizontal line to the US Dollar, the percentage change displayed in the box will represent EUR (base)/USD (quote).

  • Cardano (ADA/USD) Eyes $2 as Rally Gains Momentum

    Cardano (ADA/USD) Eyes $2 as Rally Gains Momentum

    Cardano, a decentralized blockchain platform and cryptocurrency (ADA), aims to provide a secure and scalable foundation for decentralized applications (dApps) and smart contracts. Launched in 2017 by the Cardano Foundation and developed by IOHK (Input Output Hong Kong), Cardano stands out for its research-driven development, which relies on peer-reviewed academic studies. It operates on Ouroboros, a proof-of-stake consensus mechanism designed to enhance energy efficiency and network security.

    Price Action and Elliott Wave Analysis

    Cardano concluded a bearish cycle in June 2023, marking a significant low. From this point, ADA rallied in a 5-wave structure, peaking in March 2024. A subsequent corrective pullback ensued, which completed in August 2024. Following this correction, Cardano resumed its upward momentum, forming a new impulse wave.

    After surpassing its March 2024 high, the focus shifted to identifying the next buying opportunity. According to Elliott Wave theory, the next pullback was expected to form either a 3-swing (zigzag) or a 7-swing (double zigzag) structure. These patterns often serve as reliable setups for continued bullish momentum.

    Outlook

    With Cardano now poised to approach the $2 mark, the current rally aligns with the broader technical setup. Investors and traders will watch for further confirmation of the impulsive structure and any potential retracements, which could offer attractive entry points.

    Cardano (ADA/USD) Elliott Wave chart – 12.11.2024

    Chart

    ADAUSD, H1

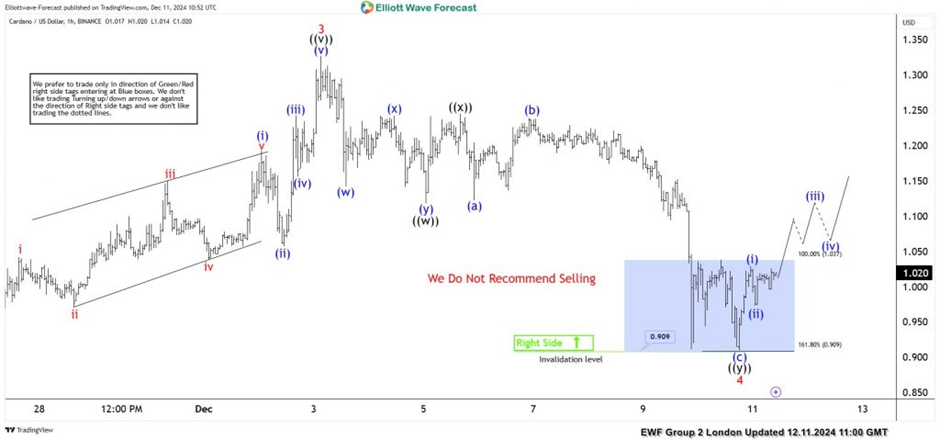
    On 12.11.2024, we shared the chart above with members citing a 7-swing structure for wave 4 on the H1 chart. In addition, we identified the 1.037-0.909 as the key blue box zone. We expected new buyers from the blue box to cause at least a 3-swing bounce if not a 5-wave recovery for wave 5. Price reached the blue and bounced as we expected. For trade management, we advised members to take partial profit at 1.066.

    Cardano (ADA/USD) Elliott Wave chart – 12.12.2024

    Chart

    ADAUSD, H1

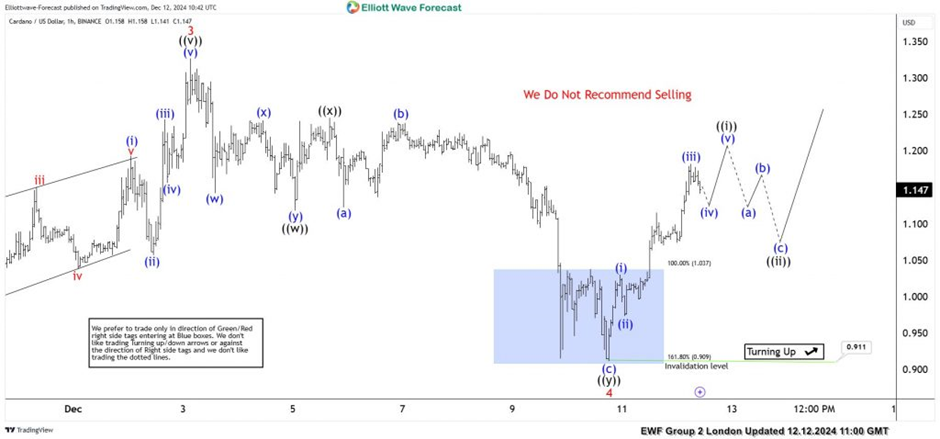
    On 12.12.2024, a day after, we shared the chart above with members. The price shows a swift separation from the blue box just as we expected. In addition, price surpassed the risk-free area. Thus, traders now run a risk-free trade after taking partial profit. Going forward, we expect wave ((i)) of 5 to finish. Afterwards, a retracement in wave ((ii)) will follow. For as long as the pullback ends above 0.911, the upside should continue.

  • AUD/USD Dips to 0.6370 Amid US Dollar Strength

    AUD/USD Dips to 0.6370 Amid US Dollar Strength

    The AUD/USD pair traded with a subdued tone during Friday’s European session, edging down to 0.6370. The Australian Dollar remains under pressure as the US Dollar gains strength on expectations of a hawkish Federal Reserve (Fed) decision next week. Friday’s session lacked significant market-moving events, keeping the focus on broader fundamentals.

    Fundamental Overview

    US Developments:
    The US Initial Jobless Claims rose to a two-month high of 242K, fueling speculation about possible policy easing by the Fed. However, stronger-than-expected inflation data from the Producer Price Index (PPI) countered these expectations.

    • Headline PPI: Increased 3% year-over-year (YoY), up from 2.4%.
    • Core PPI: Climbed to 3.4% YoY.

    This combination of mixed data kept the US Dollar firm, adding to the pressure on AUD/USD.

    Australian Developments:
    Australian employment data for November surpassed expectations, with 35.6K jobs added (forecast: 25K) and the unemployment rate falling to 3.9% (forecast: 4.2%). Despite this robust data, the Reserve Bank of Australia (RBA) maintained a dovish stance, expressing confidence in inflation gradually reaching target levels. Market expectations for a February rate cut eased, dropping from 70% to 50%.

    Technical Overview

    On the technical front, AUD/USD slipped to 0.6370, reflecting persistent bearish sentiment amid US Dollar strength.

    • RSI: Near oversold territory at 34, showing mild downward momentum.
    • MACD Histogram: Decreasing green bars indicate waning bullish momentum.

    Key Levels to Watch:

    • Support: Immediate support is seen at 0.6350. A decisive break below this level could pave the way for further losses.
    • Resistance: Strong resistance lies at 0.6400, coinciding with a key psychological barrier. A sustained break above 0.6400 could shift the short-term bias to neutral and open the door for a retest of 0.6430.

    While AUD/USD remains vulnerable, oversold conditions could trigger a corrective bounce if selling pressure eases. Traders should monitor upcoming US and Australian data, as well as the Fed’s rate decision, for further directional cues.

  • EUR/USD Price Forecast: Struggles Near 1.0500 Post-ECB Rate Cut

    EUR/USD Price Forecast: Struggles Near 1.0500 Post-ECB Rate Cut

    The EUR/USD exchange rate continues to hover around the 1.0500 level, rebounding modestly to 1.0498 after touching a weekly low of 1.0452. Technical indicators suggest a precarious balance, with potential upside momentum if the pair sustains a position above the 1.0500 threshold.

    Key resistance levels are noted at 1.0530 and 1.0600, while support levels are marked at 1.0452 and the year-to-date (YTD) low of 1.0331. For the fifth consecutive day, EUR/USD shows reluctance to stray significantly from the 1.0500 mark, despite the European Central Bank’s rate cut on Thursday, which briefly pushed the pair to 1.0452. Buyers have since stepped in, lifting the exchange rate closer to its current level of 1.0498.

    EUR/USD Price Forecast: Technical Outlook

    On the daily chart, EUR/USD remains anchored near 1.0500, unable to decisively break lower and challenge the YTD low of 1.0331. While the pair continues to form a series of lower highs, further downward movement may face resistance due to increasing buying momentum.

    The Relative Strength Index (RSI) hints at strengthening buyer activity. A daily close above 1.0500 could provide the impetus for a move higher. In this scenario, the key resistance levels are:

    • December 12 high at 1.0530
    • Psychological barrier at 1.0600
    • Last week’s peak at 1.0629

    Conversely, if EUR/USD remains below 1.0500, further losses could follow. A break below 1.0452 would expose additional downside targets, including:

    • November 26 low at 1.0424
    • November 22 swing low at 1.0331

    Traders should monitor the pair’s ability to sustain momentum near critical levels as the market reacts to the ECB’s policy decisions and broader economic factors.

  • China’s Top Legislative Body Approves Bill to Raise Local Government Debt Ceilings

    China’s Top Legislative Body Approves Bill to Raise Local Government Debt Ceilings

    China’s Vice Chairman of the National People’s Congress (NPC) Financial and Economic Affairs Committee announced on Friday that Beijing has approved a bill to increase local government debt ceilings, aiming to replace existing “hidden” debts.

    Key Takeaways:

    • China plans to raise the local government debt ceiling by 6 trillion yuan.
    • The new debt quota will be used to replace existing debt, helping to address local government debt risks.
    • The NPC’s approval will facilitate the overhaul of local government financing vehicles to curb new debt accumulation.
    • A significant policy shift, the move will allocate 6 trillion yuan in local government debt quota to resolve “hidden” debts, with 2 trillion yuan dedicated to debt swaps each year.
    • China’s “hidden” local government debt stood at 14.3 trillion yuan at the end of 2023.
  • NZD/USD Price Analysis: Pair Slides to 0.5760 as Selling Pressure Intensifies

    NZD/USD Price Analysis: Pair Slides to 0.5760 as Selling Pressure Intensifies

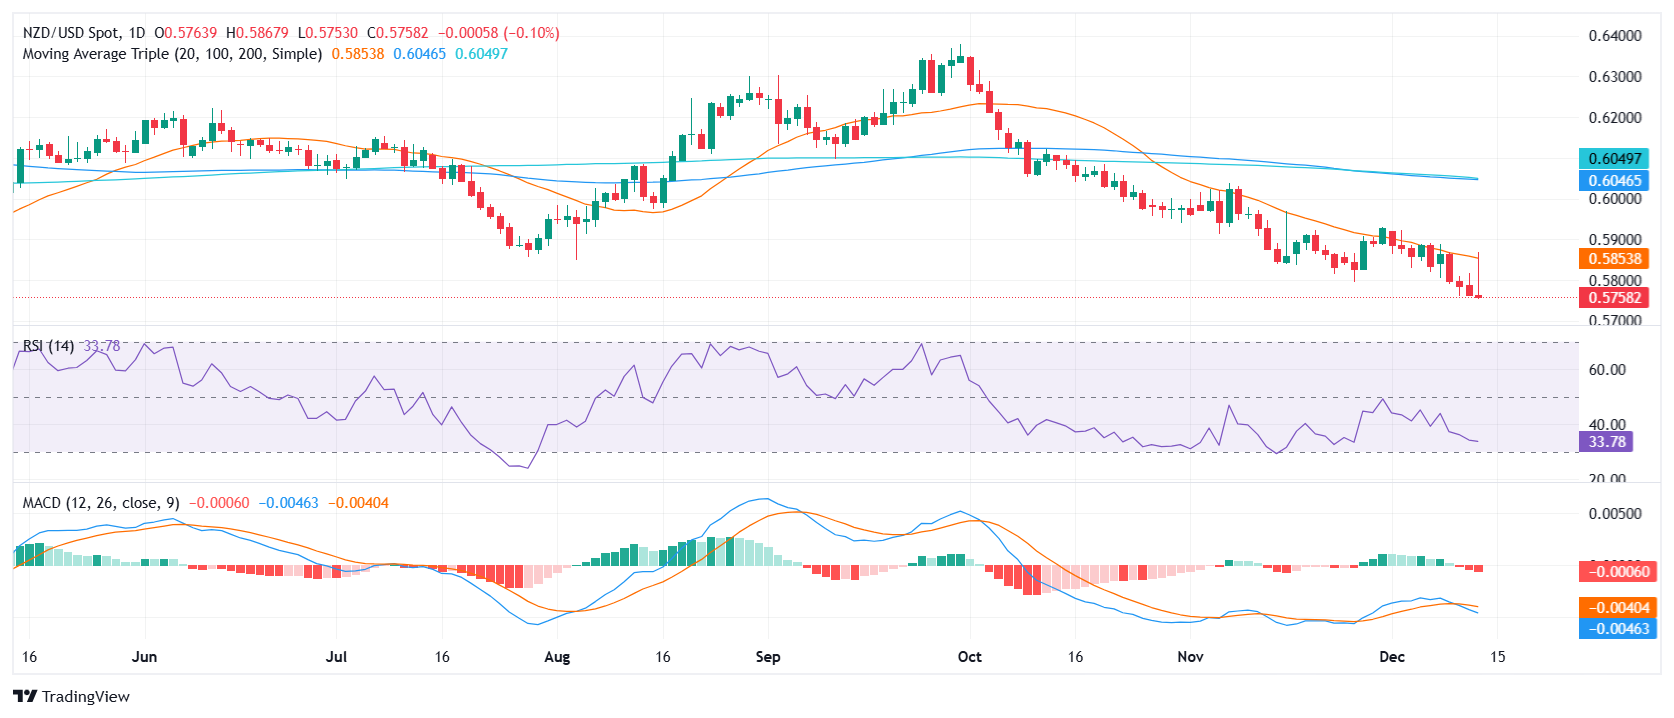
    NZD/USD dropped on Friday, settling at 0.5760 after briefly rising to 0.5850 earlier in the session. The pair remains capped by the 20-day Simple Moving Average (SMA), with any upward moves hindered by persistent selling pressure.

    Technical indicators signal a continued bearish trend. The Relative Strength Index (RSI) sits near 34, approaching oversold levels, while still pointing downward, indicating sustained weakness. Meanwhile, the Moving Average Convergence Divergence (MACD) histogram is showing rising red bars, reinforcing the intensifying bearish momentum.

    The immediate support for NZD/USD is around the 0.5750 level, followed by the key psychological level at 0.5700 if the selling pressure continues. To shift the current bearish outlook, the pair would need to break decisively above the 20-day SMA, currently near 0.5890, allowing bulls a potential opportunity to regain control.

    NZD/USD daily chart

  • Hello world!

    Welcome to WordPress. This is your first post. Edit or delete it, then start writing!